
Learn / Risk figures, explained
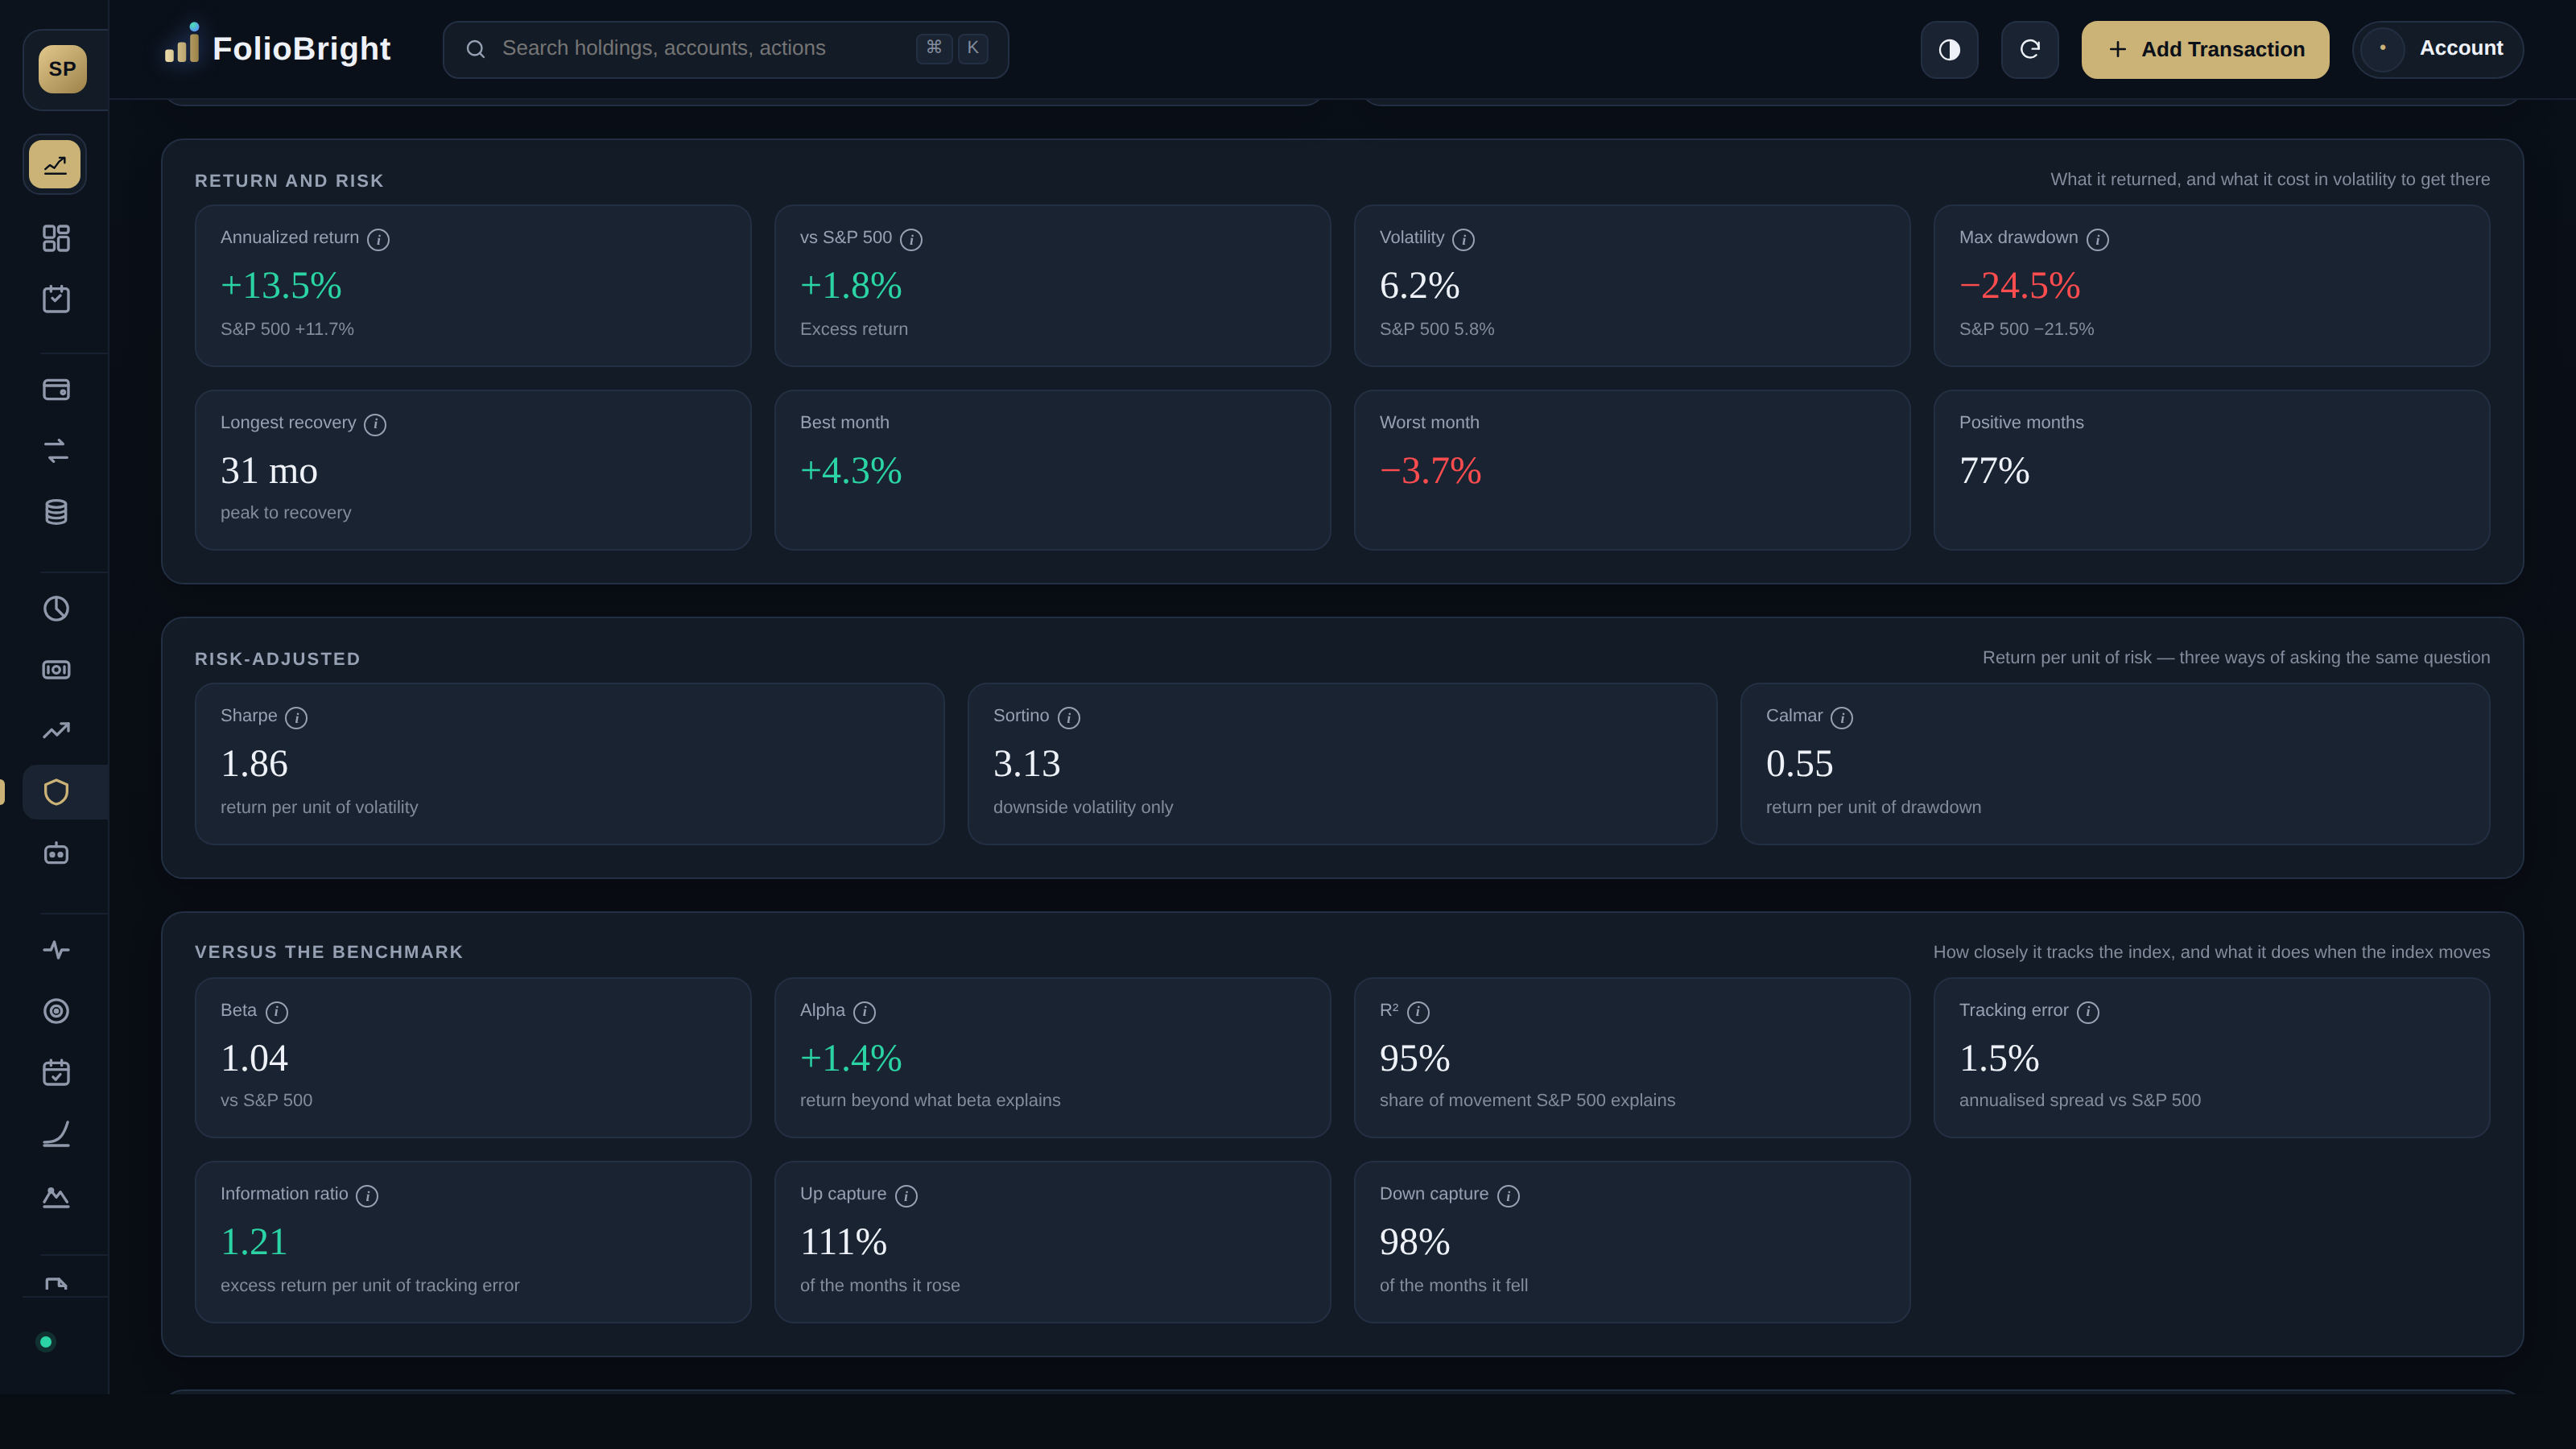
A 9% return means something different if the portfolio swung 40% to get there. Risk figures measure the swings, and how much return each unit of risk earned.
Five figures
What each measures
| Figure | What it measures | How it is worked out |
|---|---|---|
| Volatility | how widely the return swings | standard deviation of monthly returns, times the square root of 12 |
| Max drawdown | the worst fall you sat through | deepest drop from a peak to the following low, on month-end values |
| Sharpe ratio | return per unit of total risk | (annual return minus the risk-free rate) ÷ the volatility of that difference |
| Sortino ratio | return per unit of downside risk | return above a target ÷ downside deviation: each month's shortfall below the target is squared, the squares are averaged over all months (months above the target count as zero), and the square root is taken |
| Beta | how much you move with the market | slope of your monthly returns against the benchmark's |
A Sharpe ratio, worked
Say a portfolio returned 9% a year while short Treasury bills paid 4%, and its volatility was 15%. The excess return is 5%, and 5 ÷ 15 is a Sharpe ratio of 0.33. A second portfolio that returned 8% with 8% volatility has a Sharpe of 0.50: less return, but more of it for each unit of risk. A common rule of thumb calls a Sharpe above 1 strong. Over long periods most stock portfolios sit below it, and a single good year can flatter it.
When each one misleads
Volatility treats a jump up the same as a fall, which is why Sortino exists. Sortino only counts shortfalls below a target, which FolioBright sets at the risk-free rate. Beta only describes the part of your movement the market explains; a low R² beside it means most of your movement is your own and beta is a weak guide. And a short window flatters or punishes everything: a few good months stretched to a yearly rate is not a rate to act on.
How FolioBright works them out
Every figure is built from your time-weighted monthly returns, so deposits and withdrawals do not count as performance. The risk-free rate is the 3-month Treasury bill from the Federal Reserve's FRED data, the rate Sharpe is conventionally measured against. Your benchmark's own figure over the same months sits beside each one, and under twelve months the return is shown as it happened, not stretched to a yearly rate. Hover any tile for its definition.
For how the return itself is measured, see time-weighted vs personal return.
Questions
What is a good Sharpe ratio?
A common rule of thumb calls above 1 strong, and over long periods most stock portfolios sit below it. It is most useful compared with a benchmark over the same period.
What is the difference between Sharpe and Sortino?
Sharpe divides the return above the risk-free rate by all the ups and downs. Sortino divides the return above a target by the shortfall below that target only, so a jump up is not counted as risk.
What does max drawdown mean?
The largest fall from a peak to the low that followed: how far down you would have been at the worst point if you had bought at the top. FolioBright measures it on month-end values, which can miss a fall that recovered within the month.
What does a beta of 1.2 mean?
On average, a 1% move in the benchmark came with a 1.2% move in your portfolio, up or down. It is only a good guide when R² is high, meaning the benchmark explains most of your movement.